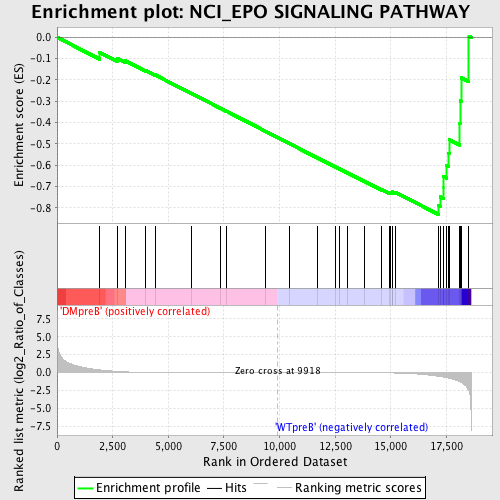
Profile of the Running ES Score & Positions of GeneSet Members on the Rank Ordered List
| Dataset | Set_04_DMpreB_versus_WTpreB.phenotype_DMpreB_versus_WTpreB.cls #DMpreB_versus_WTpreB |
| Phenotype | phenotype_DMpreB_versus_WTpreB.cls#DMpreB_versus_WTpreB |
| Upregulated in class | WTpreB |
| GeneSet | NCI_EPO SIGNALING PATHWAY |
| Enrichment Score (ES) | -0.83156663 |
| Normalized Enrichment Score (NES) | -1.6022071 |
| Nominal p-value | 0.002074689 |
| FDR q-value | 0.03973239 |
| FWER p-Value | 0.408 |
| PROBE | DESCRIPTION (from dataset) | GENE SYMBOL | GENE_TITLE | RANK IN GENE LIST | RANK METRIC SCORE | RUNNING ES | CORE ENRICHMENT | |
|---|---|---|---|---|---|---|---|---|
| 1 | MAPK8 | 6459 | 1918 | 0.379 | -0.0714 | No | ||
| 2 | HRAS | 4868 | 2695 | 0.167 | -0.0992 | No | ||
| 3 | SOCS3 | 20131 | 3056 | 0.101 | -0.1101 | No | ||
| 4 | SHC1 | 9813 9812 5430 | 3966 | 0.042 | -0.1555 | No | ||
| 5 | BCL2 | 8651 3928 13864 4435 981 4062 13863 4027 | 4399 | 0.030 | -0.1762 | No | ||
| 6 | RAP1A | 8467 | 6033 | 0.012 | -0.2630 | No | ||
| 7 | STAT5B | 20222 | 7328 | 0.007 | -0.3321 | No | ||
| 8 | TRPC6 | 19565 | 7601 | 0.006 | -0.3463 | No | ||
| 9 | PTPN11 | 5326 16391 9660 | 9360 | 0.001 | -0.4407 | No | ||
| 10 | LYN | 16281 | 10463 | -0.001 | -0.4999 | No | ||
| 11 | EPO | 8911 | 11715 | -0.005 | -0.5668 | No | ||
| 12 | PIK3R1 | 3170 | 12501 | -0.008 | -0.6084 | No | ||
| 13 | PLCG1 | 14753 | 12673 | -0.009 | -0.6169 | No | ||
| 14 | SOS1 | 5476 | 13043 | -0.010 | -0.6359 | No | ||
| 15 | EPOR | 19204 | 13803 | -0.017 | -0.6754 | No | ||
| 16 | CBL | 19154 | 14583 | -0.031 | -0.7147 | No | ||
| 17 | VAV2 | 5848 2670 | 14953 | -0.044 | -0.7308 | No | ||
| 18 | SH2B3 | 5001 16383 | 14979 | -0.045 | -0.7284 | No | ||
| 19 | JAK2 | 23893 9197 3706 | 15078 | -0.050 | -0.7295 | No | ||
| 20 | STAT5A | 20664 | 15080 | -0.050 | -0.7254 | No | ||
| 21 | RAPGEF1 | 4218 2860 | 15195 | -0.056 | -0.7269 | No | ||
| 22 | TEC | 16514 | 17142 | -0.506 | -0.7892 | Yes | ||
| 23 | MAPK14 | 23313 | 17215 | -0.531 | -0.7485 | Yes | ||
| 24 | CRKL | 4560 | 17368 | -0.613 | -0.7054 | Yes | ||
| 25 | GRB2 | 20149 | 17370 | -0.613 | -0.6541 | Yes | ||
| 26 | PLCG2 | 18453 | 17511 | -0.711 | -0.6021 | Yes | ||
| 27 | NFKB1 | 15160 | 17596 | -0.757 | -0.5432 | Yes | ||
| 28 | BTK | 24061 | 17622 | -0.771 | -0.4800 | Yes | ||
| 29 | GAB1 | 18828 | 18101 | -1.234 | -0.4024 | Yes | ||
| 30 | STAT1 | 3936 5524 | 18114 | -1.257 | -0.2978 | Yes | ||
| 31 | BCL2L1 | 4440 2930 8652 | 18161 | -1.324 | -0.1893 | Yes | ||
| 32 | PTPN6 | 17002 | 18512 | -2.552 | 0.0056 | Yes |

